
 Welcome to Part 2 in the “Indicators of Success” series, in which I look at how strongly certain statistical categories correlate to the success of an NFL team. In the first part, we looked at defensive statistics, but as I concluded in that piece, we were only looking at one side of the coin. Today we’ll examine how well the offensive statistics compare to a team’s success, again using information from the 2011 season.
(Note: Look here for Part 1 on the defense)
Here is the raw data I collected from TeamRankings.com:
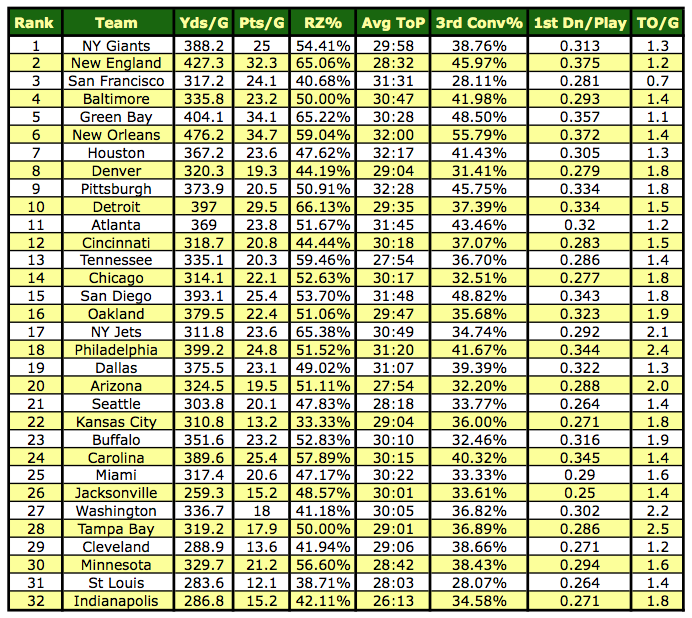
As I explained in my first post, the teams are ranked according to their 2012 NFL Draft order. While not a perfect ranking, it does take into account the number of wins each team had in addition to their success throughout the playoffs.
I used the same statistical categories as I did in Part 1 with the defense, but this time as applied to the team’s offense:
- Yards per Game (Yds/G)
- Points per Game (Pts/G)
- Red Zone Scoring Percentage, TD only (RZ%)
- Average Time of Possession (Avg ToP)
- 3rd Down Conversion Percentage (3rd Conv%)
- 1st Downs per Play (1st Dn/P)
- Giveaways / Turnovers per Game (TO/G)
As before, I’ll present you with a graph of each statistical category, followed by some brief analysis. Have a look:
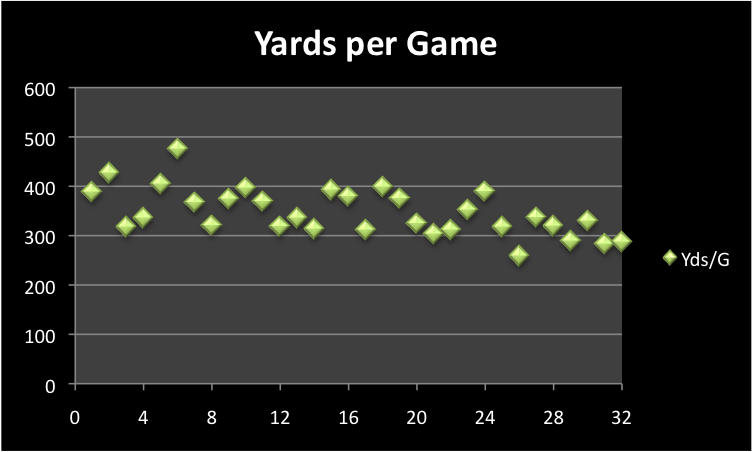
In the defensive statistics, the opponent yards per game was pretty much flat-lined. Here, however, we can see a very (very) slight downward slope. The three teams with the highest number of yards per game ranked in the top six, while the four teams with the lowest number ranked in the bottom 7.
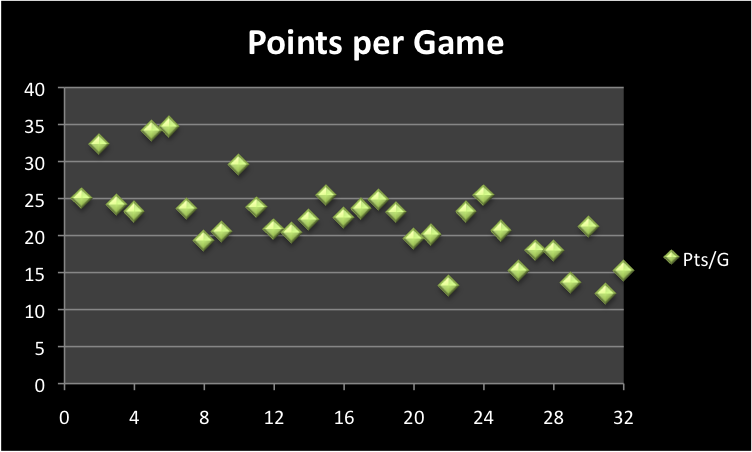
As could be expected, we see a pretty high correlation here between points scored per game and overall success. The more points you score, after all, the more games you will win. There is a very clear downward slope, with the four highest scoring teams in the top ten and the seven lowest scoring teams in the bottom eleven.
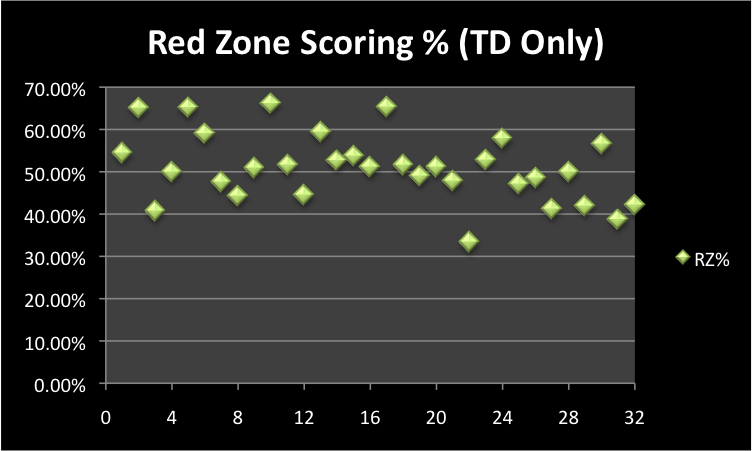
There seems to be an ever-so-slight correlation with overall success in this statistical category, but it’s hardly noteworthy. I said it in the last post, and I’ll reiterate here: this statistic seems to be more important for individual games than the larger scope of the season.
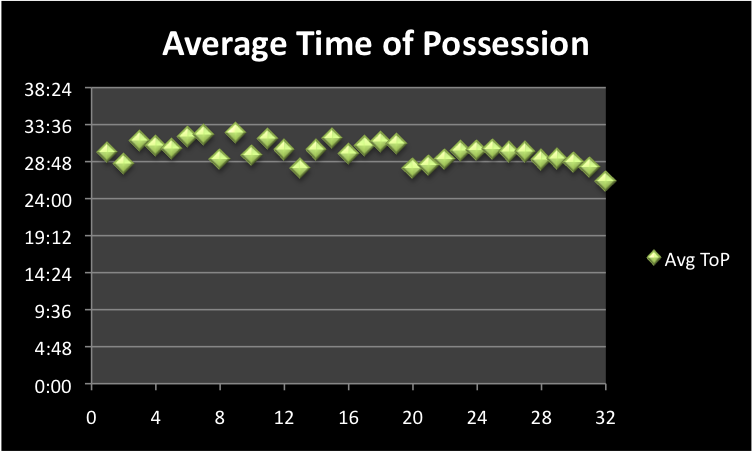
This graph is, of course, a direct inversion of the defensive category “Opponent Average Time of Possession.” There being only 60 minutes in a game, the time of possession is just the difference. And as we said in the previous post, this doesn’t really show us anything significant.
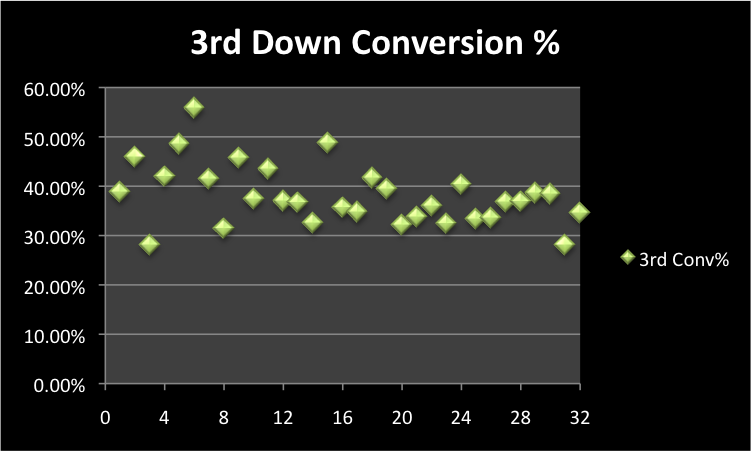
The 3rd down conversions percentage ends up being similar in nature to the average yards per game. There wasn’t much of a correlation in the defensive statistics, but the offensive side shows more of a relationship. There’s a clearer downward slope, indicating that teams who can convert at a higher rate on third downs have more overall success.
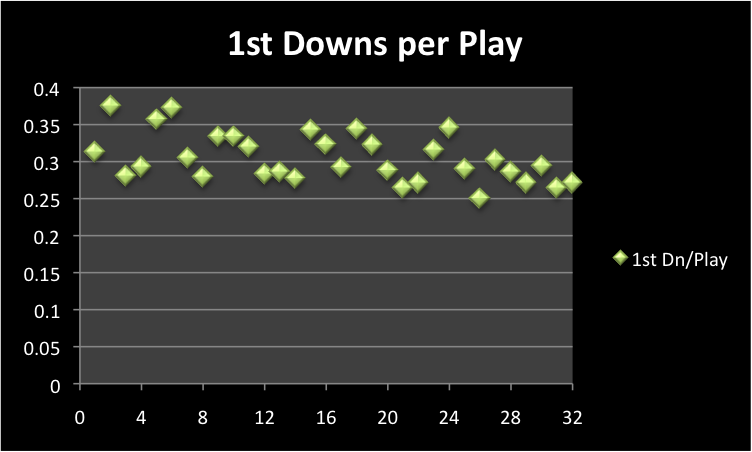
Here again we see slightly more of a correlation on the offensive side than the defensive side. We have a downward sloping graph with the three best teams in this category ranking in the top five, while the six worst teams rank in the bottom twelve.
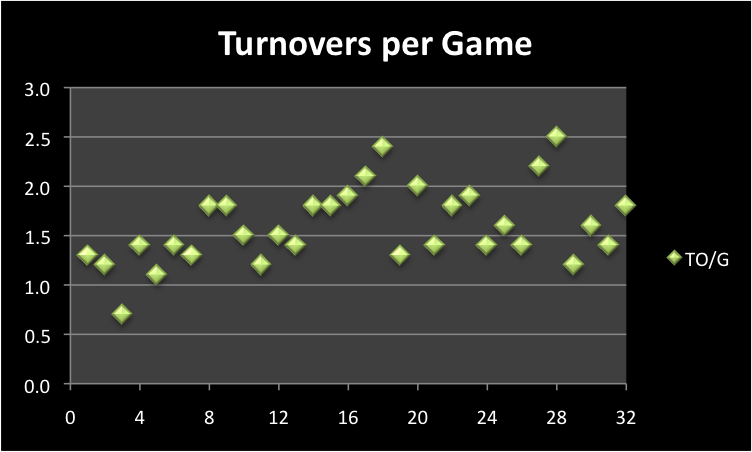
In giveaways per game, there is another obvious correlation with overall success, showing a similar slope as the number of takeaways per game from our defensive statistics. The variance here, however, seems to be a bit greater across the rankings, suggesting that the correlation might not be quite as strong.
CONCLUSION
After looking back at the analysis from Part 1: Defense, I think it’s fair to say that offensive statistics have shown themselves to be an overall better indicator of success than the defensive statistics. This, of course, helps to support the current theory that offenses are driving the league more and more these days.
Just look at the Patriots, Saints, and Packers. These three teams were leaders in just about every statistical category when it came to the offensive side of the ball; conversely, they posted average numbers at best on the defensive side. Incidentally, the one category where both New England and Green Bay did well on defense was takeaways per game.
Our analysis also explains why the Packers did so well during the regular season and yet so poorly in the playoffs. A great offense seems to be a bigger factor in long-term success than a great defense, if only slightly. On the flip side, if that offense should sputter, such as Green Bay did against the Giants in the playoffs, then it’s a lot harder to overcome.
I hope you’ve enjoyed this two-part series examining the relevance of statistics in measuring the overall success of an NFL team. And as always, feel free to post your thoughts, your criticisms, and your own analysis of the information presented.
——————Chad Toporski, a Wisconsin native and current Pittsburgh resident, is a writer for AllGreenBayPackers.com. You can follow Chad on twitter at @ChadToporski
Follow @ChadToporski——————

Looks to me like Turnovers(lack of), 3rd Down ConversionS,Points Scored, anD, to a lesser degree, Red Zone Scoring are key to Offensive success. The big qustion that remains in my mind is, was last year ana anomoly?