
 Recently, fellow writer Michael Dulka wrote a post on the Green Bay Packers defense and how signs of improvement should give us hope for 2012. A couple of comments were made discussing the relevance of the “Yards per Game” statistic that has so stigmatized last season’s defensive unit. Specifically, commenter “Sven” had this to say:
. . . Or could it be that we are using the wrong kind of ruler to measure the Packers defense. touchdowns and turn-overs are what count more than yards. Ultimately winning is what counts, and they did that in spades . . .
It raises a valid and long-standing debate about what statistics really matter when it comes to indicating a team’s success or failure. Inevitably, pundits and fans alike will find the statistics that best suit their viewpoint. In the case of the Packers last season, pessimists pointed at the yards they gave up, while optimists grounded their arguments on the number of turnovers they generated.
So what statistic(s) really encapsulates a team’s success? Well, in an effort to shed some light on the subject, I went over to TeamRankings.com and compiled some information. Here’s the raw data I collected:
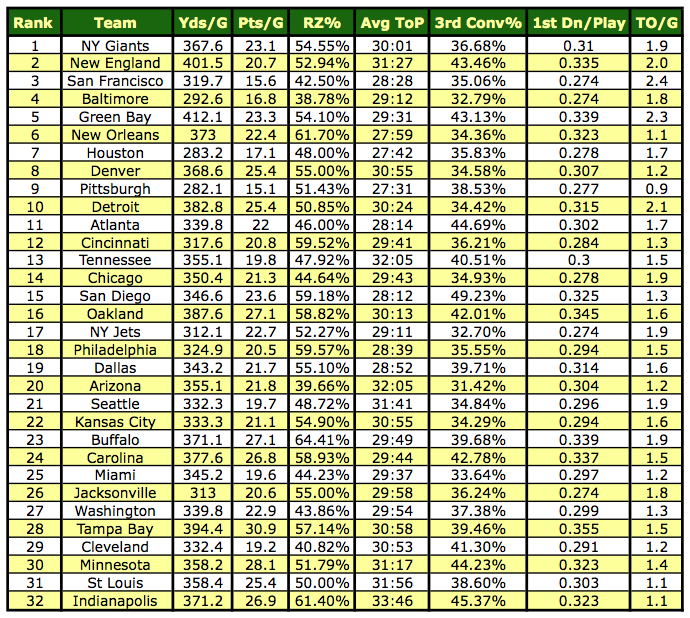
Let me explain my approach to start. In trying to get an accurate portrayal of how well each team did in 2011, I ranked them according to their 2012 NFL Draft order. This takes into account the number of wins each team had, plus their success throughout the playoffs. It’s not perfect, but it’s about as close as we’re going to get. (For example, the Broncos are ranked ahead of the Steelers, but I think that more so indicates how lousy Pittsburgh performed in the playoffs than their overall success across the season.)
This is also just one year’s worth of information, so it is admittedly limited in scope.
Next, I hand-picked seven statistical categories that I thought might be relevant to how well each team performed:
- Opponent Yards per Game (Yds/G)
- Opponent Points per Game (Pts/G)
- Opponent Red Zone Scoring Percentage, TD only (RZ%)
- Opponent Average Time of Possession (Avg ToP)
- Opponent 3rd Down Conversion Percentage (3rd Conv%)
- Opponent 1st Downs per Play (1st Dn/P)
- Takeaways / Turnovers per Game (TO/G)
Finally, I decided that graphs would be an easier medium to use in analyzing this data than a simple chart. Below, you will find a graph for each statistical category, plus some brief analysis.
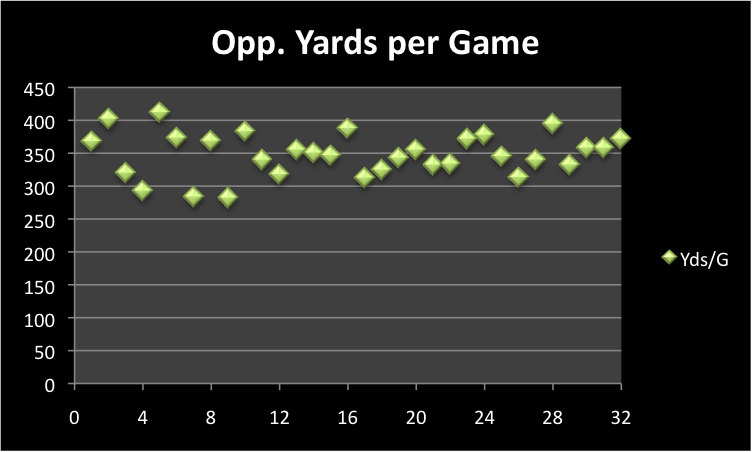
This one is a bit interesting. On the one hand, the only three teams to limit their opponents to less than 300 yards (on average) were all in the top ten – Pittsburgh, Houston, and Baltimore. On the other hand, the top two teams with the worst statistical average (New England and Green Bay) were both in the top five.
There’s no clear slope one way or the other, but the upper ranking of teams are much more varied in this statistic.
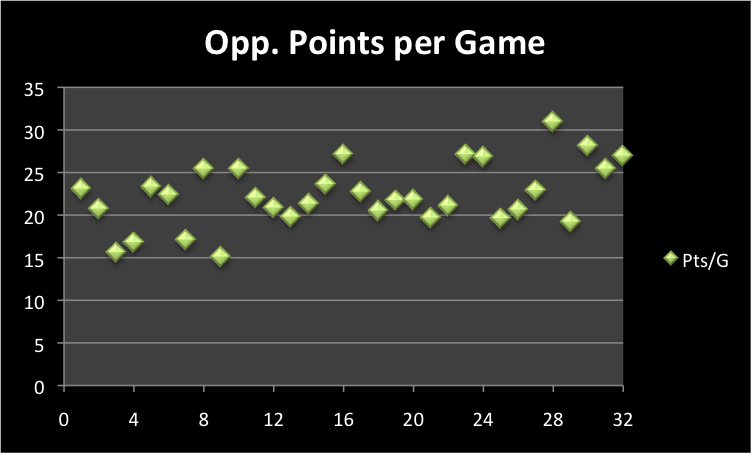
The graph for this statistical category has a clear slop upward, which makes sense. The more points you allow your opponent to score, the less success you will tend to have. Four of the top ten teams on average held their opponents to less than 18 points. Still, it’s not a very strong slope, and some of the top teams landed above the league average.
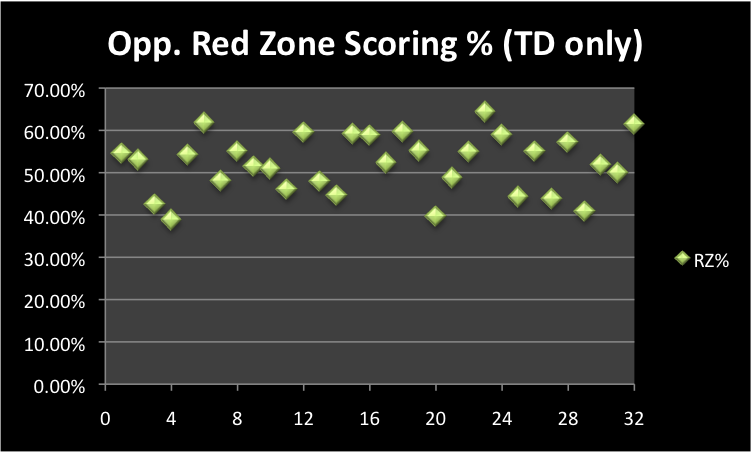
You’d think this statistic would have more of an impact on a team’s success, but there doesn’t seem to be much correlation at all. Yes, it’s still an important factor in winning individual games; it just doesn’t appear to extend beyond that scope.
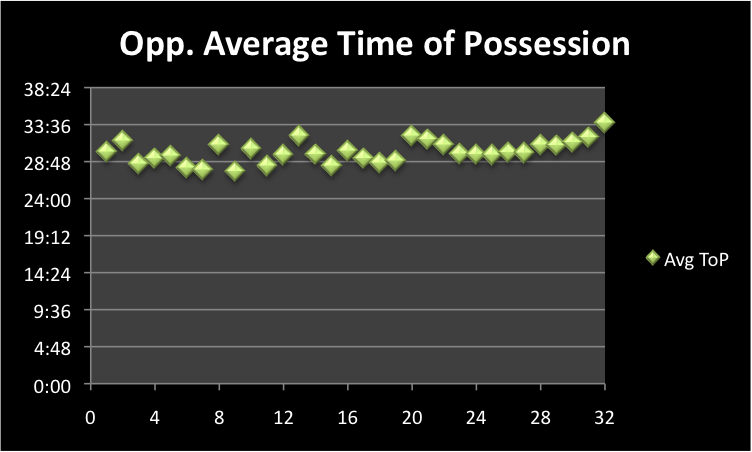
This one is a bit interesting. There appears to be a slope ever so slightly upward, but nothing terribly significant. However, if cut the rankings in half, the top teams would tend to be below the league average, while the bottom teams would tend to sit above the average.
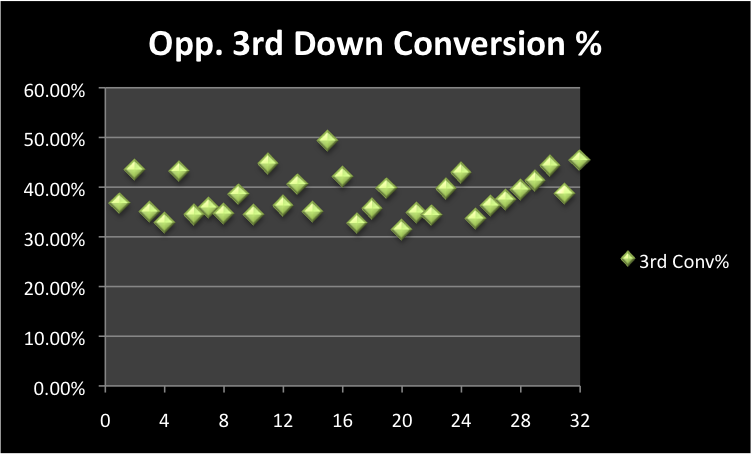
Here’s another category that I think matters more to individual games than overall success. Nevertheless, if you removed the Patriots’ (#2) and Packers’ (#5) dots from the graph, you’d see a clearer grouping of the top teams on the lower side of the league average.
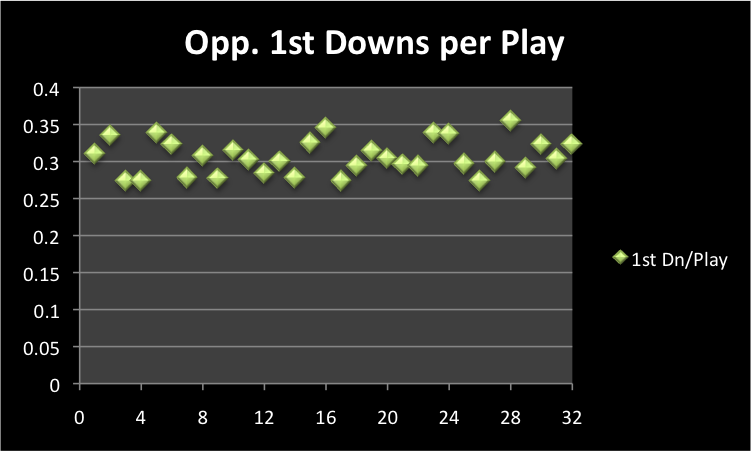
Again, this statistical category doesn’t seem to have much relevance at all. The points are pretty uniform throughout the rankings, with no strong slope upwards or downwards.
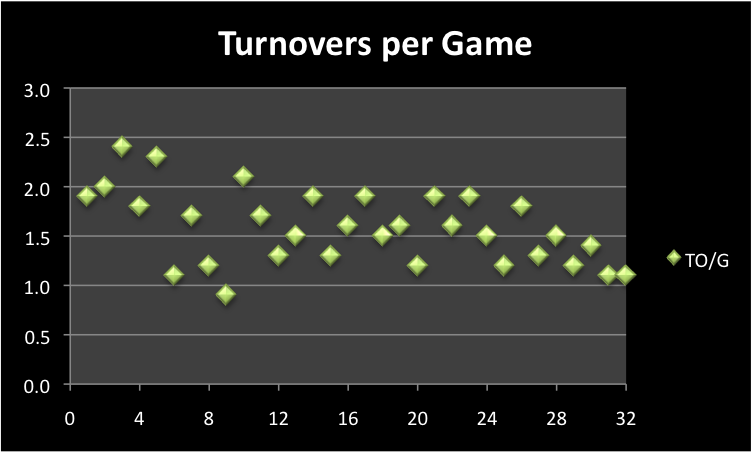
Here’s where it gets interesting again, and where some of you might be able to say “I was right.” (“I” meaning you, not me.) There is a very clear slope downwards in this graph; however, just like with Yards per Game, we see a wider variance towards the stop side of the team rankings. Incidentally, the team that ranked the best in opponent yards per game and points per game was also the team that ranked worst in takeaways per game. That team was the Pittsburgh Steelers.
CONCLUSION
There are obviously some defensive statistics that are a greater indicator of a team’s success than others. The strongest correlation of the group appeared to be turnovers, which, to be honest, is not quite what I expected. Others of you should, of course, feel better in maintaining that turnovers mean more than yards allowed.
All that said, we’re still only looking at one side of the coin. The old adage is that an offense wins games and a defense wins championships, but is that really the case? In the next “Packing the Stats” post, I’m going to use this same approach with offensive statistics to see how it all compares. Will it show stronger indicators of success than the defensive statistics?
Finally, I also think that we’ve proven how limited statistics really are. You can’t just pick one stat out of a hat and use it to gauge a defense. Statistics are nice to show tendencies and to provide a foundation for further analysis, but they are not the whole story, especially when used “in a vacuum.” It’s why sites like Football Outsiders have been trying to find more comprehensive ways of measuring teams and individual units. Their DVOA statistics attempt to dig deeper into situational stats that provide a better measure of success.
As always, feel free to post your thoughts, your criticisms, and your own analysis of the information presented.
——————Chad Toporski, a Wisconsin native and current Pittsburgh resident, is a writer for AllGreenBayPackers.com. You can follow Chad on twitter at @ChadToporski
Follow @ChadToporski——————

Wow. Great breakdown.
3rd down conversion killed the Packers last year. Their defense did a great job countering this element with turnovers. But bad 3rd down D impacts all other D stats. Yards per game, Scoring, Time of Possession, etc. Capers must fix the 3rd down D. All the other “Stats” will follow.
People like to talk about 3rd down conversion percentage, and rightfully so… As we all know, if you allow the opponent to convert on 3rd down, it means they gained positive yardage and get up to four more attempts to move the ball and/or score. Yeah, I know, obvious.
The real question is, and this is where the data needs to be looked at closely- WHY is a team allowing 3rd downs to be converted and not getting off the field?
Is it poor play calling or improper adjustments at the LOS? A personnel issue of some sort?
Is it poor performance on 1st and 2nd down that puts the defense in less-than-manageable situations on 3rd down?
From a tactical standpoint, there is a huge difference in the amount of stress put on a defense depending on if it’s 3rd and 7 or if it’s 3rd and 4. On the flip side of the equation, it’s why OC’s always talk about getting into managable 3rd down situations- 3rd and 4 or less opens up the entire breadth of your playbook.
You have to determine if poor 3rd down defense is the ailment or a symptom of a different problem.
An excellent idea for another post when I get back from vacation. And I think I have a good jumping off point with some of the FO Almanac stats.
Two stats that are often bandied about as measures of defensive success are yards per pass(30th last year, 4th in 2010) and opponent passer rating (11th last year, #1 in ’10). I realize that only takes into account the passing game, but that is were the bulk of yards are earned. You could compare those with yards per carry just to be complete(25th and 26th).
PPG, 19th @ 22.4
TOP is also a telling stat.
Thanks for using my comment!
I remember listening to some Dom Capers interviews last year and he was preaching oponent QB rating as being a criticle stat, and one that he paid attention too.
I wonder how all of last years teams defenses did on that stat?
I just checked… and it is a pretty good indicator of who was a good team and who not, with the exception of N.E. and N.O. who were in the lower echelon of defenses in this catagory but still play-off teams.